
Zephyr from Zero on the ST Nucleo-F401RE: Watching the Scheduler Work
A complete beginner's path onto the Zephyr RTOS using the low-cost ST Nucleo-F401RE, from installing the toolchain to a four-thread demo whose scheduling you can watch on a logic analyser.

Watching the Scheduler Work
This article is part of a series on RTOS fundamentals with the ST Nucleo-F401RE:
- Zephyr from zero: the toolchain, the board, and the scheduler on a scope – this article
- The same demo in async Rust with Embassy (coming soon)
- One firmware, three boards: Zephyr devicetree portability (coming soon)
Every embedded tutorial starts with a blinking LED, and there is a problem with that: blinky teaches you the build system, but it teaches you nothing about the thing you actually installed. Zephyr is a real-time operating system. Its heart is a pre-emptive scheduler that decides, tens of thousands of times per second, which of your threads deserves the CPU. In a blinky, that complex machinery is invisible.
This guide makes it visible. We will set up the Zephyr toolchain, and then build a small application with four threads, each wired to its own GPIO "probe" pin. Connect a logic analyser (even a cheap €10 clone will do) and you can watch the scheduler at work: two equal-priority threads being round-robined in neat 10 ms slices, a higher-priority thread punching holes in their timelines, and a button press pre-empting everything within microseconds. No prior Zephyr experience is assumed.
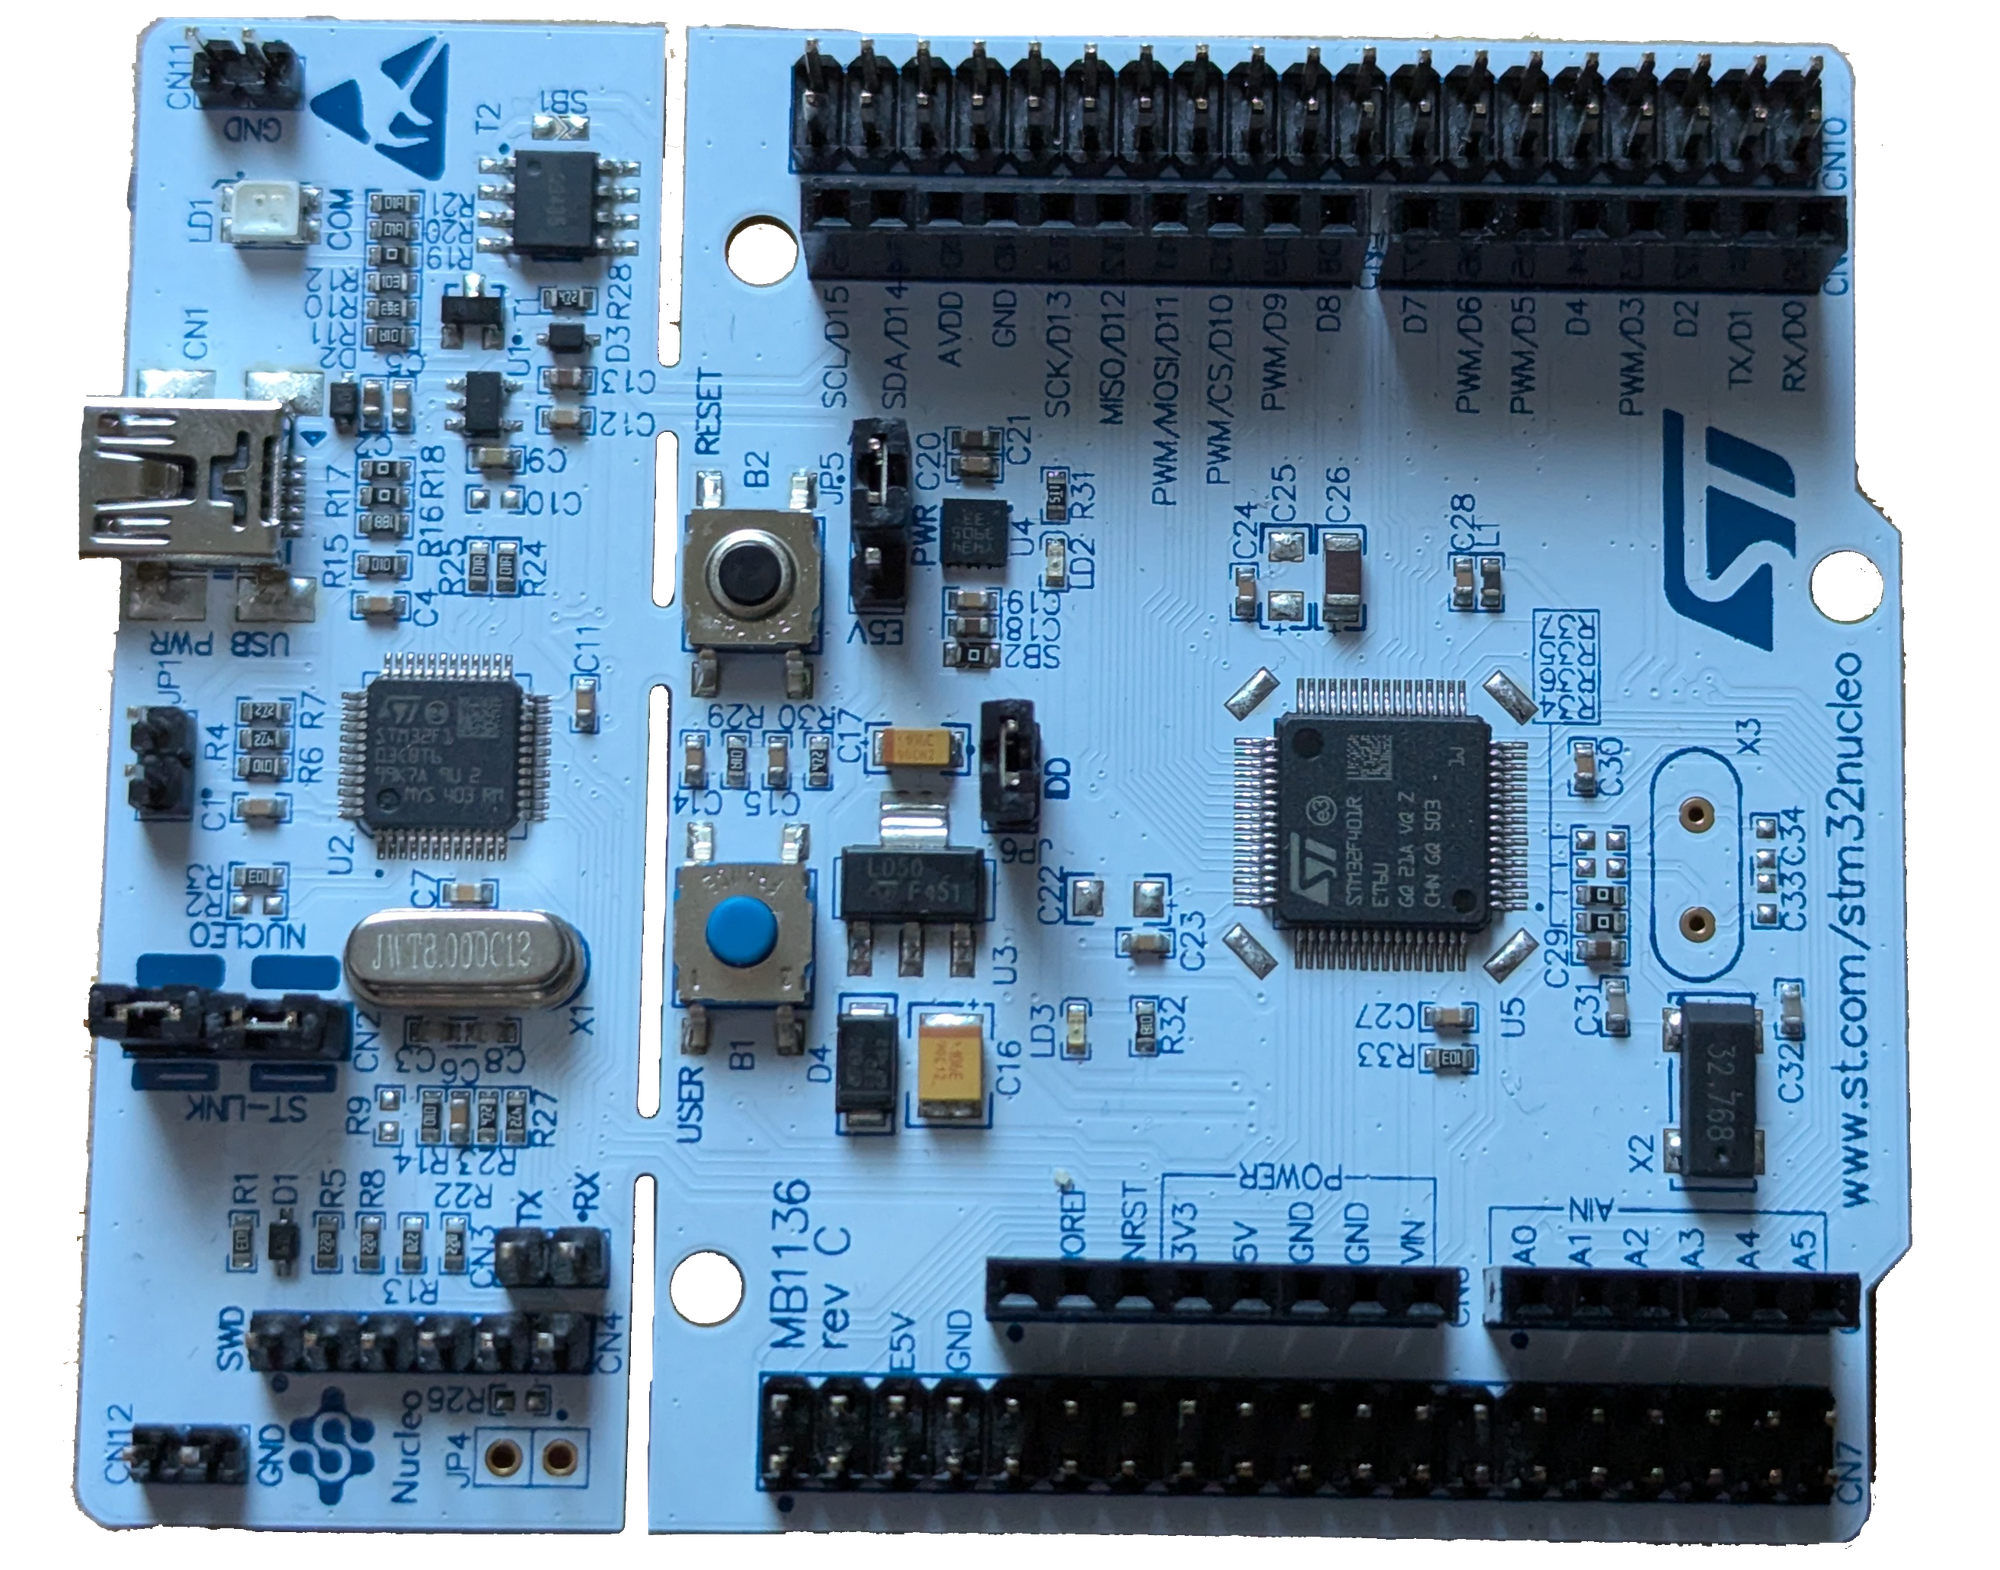
MB1136 rev C. Worth orienting yourself before you start, because everything this article asks you to use is visible here. The ST-LINK occupies the third, to the left of the perforated line it can be snapped off along, with its USB Mini-B socket on the far left. B2 RESET is the black button and B1 USER the blue one. The Arduino header along the top edge carries the silkscreened D0 to D15 labels, and the probe pins used later are D2 to D5 at its right-hand end; CN7 and CN10 along the bottom and top are the morpho headers that expose every remaining pin, including PC13 for the button.nucleo_f401re.Why this board?
The ST Nucleo-F401RE has been around for over a decade, and that is precisely why it is a perfect first Zephyr board. It costs around €15, it is stocked everywhere, thousands of university labs already have them, and, most importantly, it has a debugger built in. The upper section of the board is a complete ST-LINK/V2-1 probe, which gives you four tools through one USB cable:
- a programmer, so flashing needs no extra hardware;
- a debugger, so breakpoints and single-stepping work out of the box with
west debug; - a virtual COM port, which Zephyr uses for its console and shell; and
- a mass-storage bootloader: the board appears as a USB drive called
NOD_F401RE, and you can program it by dragging a.binfile onto that drive. (Much of the internet writes that label asNODE_F401RE. On my board it isNOD_F401RE, without the E, and it stayed that way across a seven-year ST-LINK firmware upgrade, so this is not a question of an old board showing an old name. Go by what actually appears in Explorer rather than by what any guide says, this one included.)
Do not generalise this to "Nucleo boards use Mini-B", because the family has moved on. The recent Nucleo-64 boards built around the STLINK-V3EC debugger use USB-C, and some Nucleo variants use Micro-B. The connector tracks the debugger generation rather than the board size, so look at the photograph on the listing, or at the board itself.
That "Radios: none" row is not a gap for a first board. Wireless stacks are where embedded projects get complicated (my XIAO nRF52840 series spends most of its time there). Here there is no network to commission and no border router to configure: it is the kernel and some wires, which is the right place to learn what an RTOS actually does.
How it compares
If you are choosing a first Zephyr board, or wondering whether the one in your drawer will do, this is the landscape as of mid-2026 (prices are approximate):
Every board in that table is well supported in mainline Zephyr, and the beauty of the devicetree system (below) is that the code in this article runs on all of them with only a pin-mapping overlay changed, which is exactly what a future article in this series demonstrates. But for learning, the Nucleo's built-in debugger is the difference between "add a printk and reflash" and "set a breakpoint and look". The others make you buy and wire an external probe before you can single-step; the Nucleo gives you that on day one.
What is Zephyr?
Zephyr is a full real-time operating system maintained under the Linux Foundation: a pre-emptive scheduler, a device driver model, networking, filesystems, and a build system, developed as one large open-source project and used heavily in industry. Four ideas define how it works, and this article exercises all of them:
- Pre-emptive threads. Your application is a set of kernel threads with priorities. The scheduler can stop a lower-priority thread mid-instruction to run a higher-priority one that has just become ready. This is the core of the article.
- Devicetree. Hardware is described in
.dtsfiles, separately from your C code. Your program asks for "the LED with aliasled0" rather than "pin PA5", which is how one application builds unchanged across hundreds of boards. - Kconfig. Features are switched on and off with
CONFIG_symbols in aprj.conffile, exactly like configuring the Linux kernel. Want a command shell? That is one line, not a library to vendor in. - west. Zephyr's meta-tool, which fetches the source tree and wraps building, flashing, and debugging. You will type
west buildconstantly.
The cost of all this is a steep first day: the install is measured in gigabytes and the terminology is unfamiliar. The rest of this guide walks that first day slowly, because after it, the second day is much easier.
Setting up the toolchain
This section assumes a Windows machine, since that is what I use for this series; the official Getting Started Guide has the exact equivalents for Linux and macOS, and the steps have the same shape (on Ubuntu, the prerequisites come from apt, and everything from west init onwards is identical).
1. Install the prerequisites
Zephyr needs Python 3.10 or newer, Git, CMake, Ninja, the devicetree compiler dtc, and gperf. Chocolatey is the smoothest route on Windows because it is what the Zephyr documentation assumes, and it carries every one of those packages. Run this from an elevated PowerShell (right-click, "Run as Administrator"):
choco install cmake --installargs 'ADD_CMAKE_TO_PATH=System'
choco install ninja gperf python git dtc-msys2 wget 7zip
Two of those deserve a a brief discussion. gperf generates perfect hash tables during the build; it is easy to leave out because nothing mentions it until a build fails somewhere deep and unhelpfully. And the ADD_CMAKE_TO_PATH=System argument on CMake is described in the next box.
PATH environment variable when a terminal starts, so after installing, close and reopen PowerShell. CMake's installer goes further: left to its own devices it registers itself for the current user's interactive shells only. The symptom is baffling, because cmake works perfectly when you type it and is "not recognised" the moment a build script runs. ADD_CMAKE_TO_PATH=System above is the fix; if you have already installed CMake without it, either reinstall or prepend the install directory (typically C:\Program Files\CMake\bin) to PATH inside the script itself. This one cost me an hour on Windows.pip install -r zephyr\scripts\requirements.txt for the Python dependencies and installed the SDK to an explicit directory. Current Zephyr replaces the first with west packages pip --install and the second with a bare west sdk install, both used below. The prerequisites in this section are otherwise identical, so an existing workspace needs nothing done to it.2. Create the workspace
Zephyr lives in a workspace: one directory holding the Zephyr source, its module repositories, and your applications side by side. Create it with a Python virtual environment at the top, so the Python tooling stays isolated from the rest of your machine:
mkdir C:\zephyr
cd C:\zephyr
python -m venv zephyrproject\.venv
zephyrproject\.venv\Scripts\Activate.ps1
pip install west
Your prompt gains a (.venv) prefix. You will activate this venv at the start of every Zephyr session (the Activate.ps1 line alone), and every command from here on assumes it is active.
Now let west fetch Zephyr and its modules. This downloads several gigabytes and takes a while; make coffee:
west init zephyrproject
cd zephyrproject
west update
west zephyr-export
west packages pip --install
Know the three levels, because the middle catches people out. When west update finishes you have a directory tree that looks like this, and the distinction between its levels is the source of "the file is not where the guide says it is":
C:\zephyr\                     <- just a container
├── zephyr-sdk\                <- the SDK: cross-compilers, OpenOCD. No samples.
└── zephyrproject\             <- THE WORKSPACE. Your apps live here.
    ├── .venv\
    ├── bootloader\            <- MCUboot
    ├── modules\               <- HALs, crypto, filesystems, OpenThread...
    ├── tools\
    └── zephyr\                <- THE ZEPHYR SOURCE TREE
        ├── boards\            <- every supported board, including nucleo_f401re
        ├── drivers\
        ├── dts\
        ├── samples\           <- the samples are HERE
        └── subsys\
Two traps in that tree. The SDK is not the source: zephyr-sdk holds toolchains and host tools, and contains no samples, no boards, and nothing you will ever cd into. And the workspace is not the source either: zephyrproject is the outer directory holding Zephyr alongside its modules and your own applications, so samples is one level further down, in zephyrproject\zephyr\samples. Your own projects, by contrast, go directly in zephyrproject, as siblings of zephyr. That is the arrangement that makes west build able to see both at once.
Every new terminal needs two lines before it can build. The virtual environment and the working directory both reset when you close the window:
C:\zephyr\zephyrproject\.venv\Scripts\Activate.ps1
cd C:\zephyr\zephyrproject
west: command not found almost always means the first line was skipped, and a build that cannot find its source almost always means the second was. Every command from here on assumes you are in C:\zephyr\zephyrproject with (.venv) on your prompt.
3. Install the Zephyr SDK
The SDK is the collection of cross-compilers (one per CPU architecture) plus the host tools Zephyr needs, including OpenOCD for flashing and debugging ST boards. One command fetches and registers it:
west sdk install
4. Verify with blinky
Before writing any code of our own, prove the whole chain works using a sample from the Zephyr tree. Run this from the workspace root, C:\zephyr\zephyrproject, because the path to the sample is relative to wherever you are standing:
cd C:\zephyr\zephyrproject
west build -b nucleo_f401re zephyr\samples\basic\blinky -d build-blinky --pristine
--pristine is for, and when you actually need it. It deletes the build directory and starts again from nothing. It is not required here, on a directory that does not yet exist, but it costs a few seconds and it heads off the most common early problems, so I use it whenever I am proving something works.The reason it matters is that a build directory is not just object files. It also remembers which board you targeted, which application you pointed at, and the absolute path of everything involved. Point the same build directory at a different combination and CMake will either complain in language that has nothing obviously to do with what you changed, or, worse, quietly rebuild the thing you had before. You need a pristine build when:you switch boards in an existing build directory, say from
nucleo_f401re to xiao_ble;- you switch applications, for example reusing a directory that last built blinky to build the scheduler demo below;
- the workspace has moved or been renamed, which produces the giveaway
The current CMakeCache.txt directory ... is different than the directory ... where CMakeCache.txt was created;- the SDK or toolchain has been upgraded under an existing build.
You do not need it for ordinary work. Editing
src/main.c, prj.conf, or an overlay is detected and handled, and forcing a pristine build every time just makes your edit-compile loop slow for no benefit.Two habits make the whole problem mostly disappear. The first is the one this article already follows: give every project its own
-d directory, so build-blinky and build-nucleo never collide and there is nothing stale to inherit. The second is to let west decide for you, once: west config build.pristine autoWith that set, west compares what you have asked for against what the build directory remembers and cleans it only when the two disagree. It is the setting I would have wanted on my first day.
If west reports that it cannot find the source directory, you are almost certainly one level out: from C:\zephyr the path would need to be zephyrproject\zephyr\samples\basic\blinky, and from inside the source tree itself it is just samples\basic\blinky. Check with dir zephyr\samples\basic\blinky, which should list a CMakeLists.txt, a prj.conf, and a src directory.
If the build ends with a memory-usage table rather than an error, your toolchain is complete:
-- Zephyr version: 4.4.99 (C:/zephyr/zephyrproject/zephyr), build: v4.4.0-7043-g777ab585520e
[157/157] Linking C executable zephyr\zephyr.elf
Memory region         Used Size  Region Size  %age Used
           FLASH:       17296 B       512 KB      3.30%
             RAM:        4480 B        96 KB      4.56%
           SRAM0:           0 B        96 KB      0.00%
        IDT_LIST:           0 B        32 KB      0.00%
Hold on to that 17 KB, because it is the baseline the rest of this article is measured against: a complete Zephyr kernel, the GPIO driver stack, and blinky itself, in 3.3% of the flash. The two empty regions are normal. SRAM0 is the same physical memory as RAM described a second way, and IDT_LIST is a build-time scratch area for interrupt table generation that never reaches the device.
Now plug the Nucleo in over USB and flash it:
NOD_F401RE drive and read DETAILS.TXT. Mine said this: Version: 0221Build: Jan 7 2019 18:14:15Read the build date, not the version number. On old firmware that
Version field is an mbed interface number that tells you nothing about the ST-LINK: this board's real firmware turned out to be V2J33M25, which 0221 does not resemble in any way. The January 2019 build date is the part that means something, and it made the debugger seven years old. (The same 0221 also turns up inside MBED.HTM, where it is part of a static board identifier and does not change when you upgrade, so do not read that as a version either.)Stale ST-LINK firmware is a well-known source of exactly the failures that are hardest to attribute: drag-and-drop programming that reports success and does not take, connections that drop under a debugger, and newer host tools that refuse to talk to it at all. None of those announce themselves as a firmware problem, and all of them will send you looking at your code instead.
The upgrade takes two minutes. Install STM32CubeProgrammer, choose ST-LINK in the connection dropdown at the top right, and press Firmware upgrade in the ST-LINK configuration panel. ST also ship the same utility standalone as STSW-LINK007, which is the
STLinkUpgrade window you end up in either way: press Open in update mode, then Upgrade. You do not need to connect to the target MCU first, whatever other guides tell you, because the tool talks to the debugger rather than through it. Close STM32CubeIDE, any OpenOCD session, and any serial terminal on the board beforehand, because only one program at a time can hold the ST-LINK.Leave the "Change Type" checkbox alone. It is how you would switch the debugger between firmware variants, and the one you want is the default already reported:
STM32 Debug+Mass storage+VCP. All three parts earn their place here. Debug is west flash and west debug, mass storage is the drag-and-drop fallback below, and VCP is the console and shell you will spend the second half of this article inside. A variant without mass storage is a reasonable thing to want on a production bench, where an unexpected removable drive is a nuisance, but on this board it would quietly delete two of the four tools it was chosen for.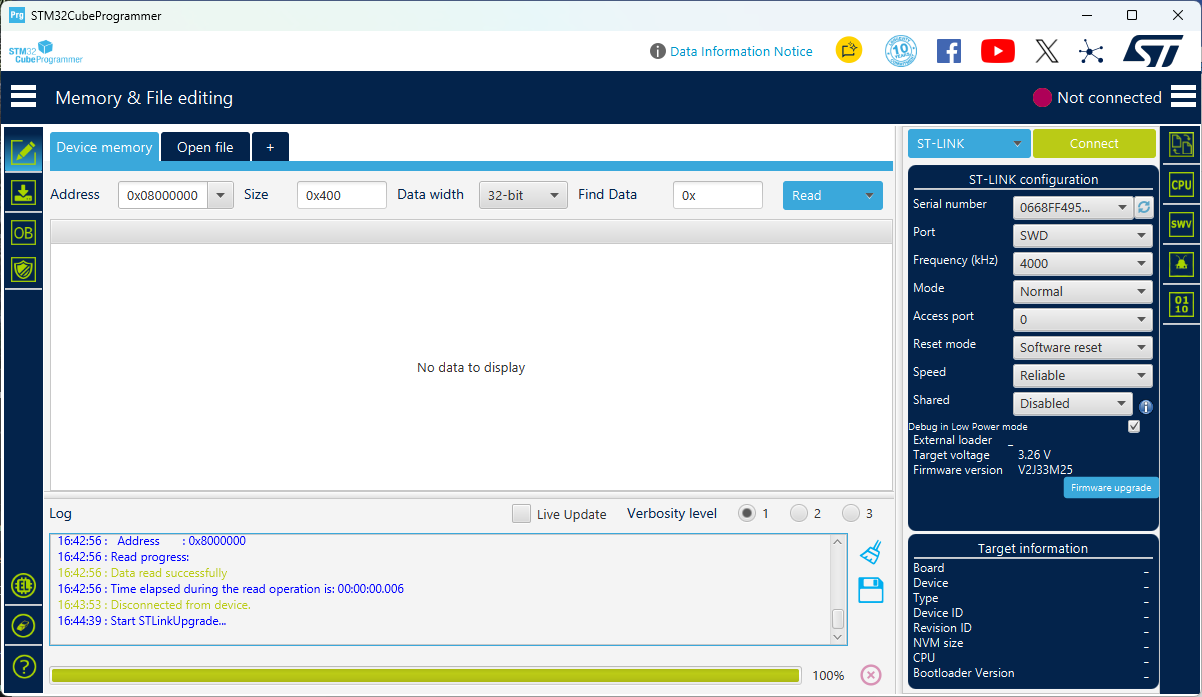
V2J33M25 and the Firmware upgrade button beneath it. Note the header still reads "Not connected" and the target voltage is already showing 3.26 V. The tool reads and updates the debugger without ever attaching to the STM32, which is why there is no Connect step in the instructions above.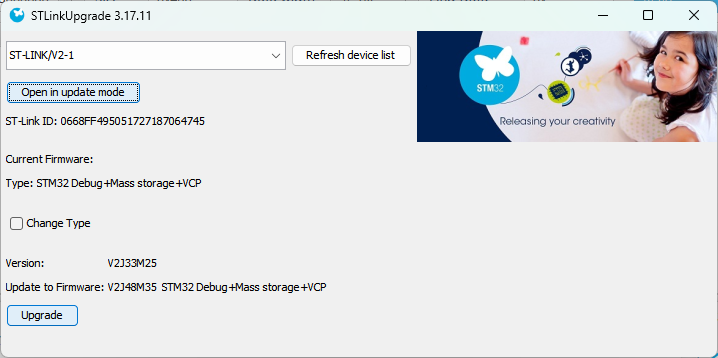
STLinkUpgrade after pressing Open in update mode. The current type is STM32 Debug+Mass storage+VCP and the pending update keeps it. The M in V2J33M25 is the mass-storage variant, which is what "Change Type" would let you abandon, so leave it unchecked.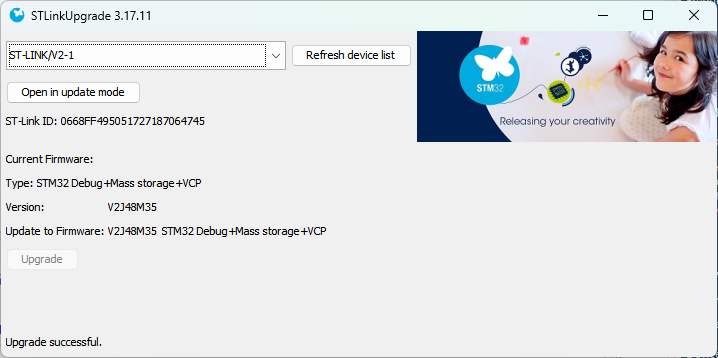
V2J33M25 to V2J48M35, same type, "Upgrade successful". Afterwards DETAILS.TXT on the mass-storage drive reports that version string directly instead of the uninformative 0221, so on a freshly updated board the drive is a reliable place to check.west flash -d build-blinky
On this board that produces:
-- west flash: using runner stm32cubeprogrammer
      -------------------------------------------------------------------
                       STM32CubeProgrammer v2.23.0
      -------------------------------------------------------------------

ST-LINK SN  : 0668FF495051727187064745
ST-LINK FW  : V2J48M35
Board       : NUCLEO-F401RE
Voltage     : 3.26V
SWD freq    : 4000 KHz
Connect mode: Under Reset
Reset mode  : Hardware reset
Device ID   : 0x433
Device name : STM32F401xD/E
NVM size    : 512 KBytes
Device CPU  : Cortex-M4

Opening and parsing file: zephyr.hex
  Size          : 16.89 KB
  Address       : 0x08000000

Erasing internal memory sectors [0 1]
Download in Progress:
██████████████████████████████████████████████████ 100%

File download complete
Time elapsed during download operation: 00:00:00.692
The green LED LD2 should now blink once per second. Note the board identifying itself and reporting the firmware version from the upgrade above, which is a solid confirmation that everything upstream is wired correctly.
west flash does not use OpenOCD on this board, and that matters if you skipped the firmware upgrade. Read that first line again: using runner stm32cubeprogrammer. Zephyr calls its flashing back-ends runners, and each board declares which ones it supports and in what order. ST's boards/st/nucleo_f401re/board.cmake lists three, with a comment:# keep firstinclude(${ZEPHYR_BASE}/boards/common/stm32cubeprogrammer.board.cmake)include(${ZEPHYR_BASE}/boards/common/openocd-stm32.board.cmake)include(${ZEPHYR_BASE}/boards/common/jlink.board.cmake)First in the list is the default, so a bare
west flash reaches for STM32CubeProgrammer, and here is the catch: that tool is not part of the Zephyr SDK. It is a separate ST download. Everything in the toolchain section above, Chocolatey and west sdk install included, leaves you without it. Follow this guide to the letter, skip the firmware-upgrade note, and your very first west flash fails on a missing tool rather than on anything you did wrong. I only avoided that by accident: STM32CubeProgrammer was already installed, because upgrading the ST-LINK firmware an hour earlier required it. Those two steps look unrelated and are not.You have two ways out:
- Install STM32CubeProgrammer, which you want anyway for the firmware upgrade, and change nothing else.
- Ask for OpenOCD explicitly with
west flash -r openocd. OpenOCD does ship in the SDK, at zephyr-sdk\hosttools\openocd, so this route needs no additional download at all.Run
west flash -d build-blinky --context at any time to see the runners available for your board and which one is the default. It is the fastest way to answer "what is this command actually about to do?"If west flash gives you any trouble at all, remember the zero-software fallback. The board appears as a USB drive named NOD_F401RE, and copying the binary onto it programs the chip just the same:
copy .\build-blinky\zephyr\zephyr.bin I:
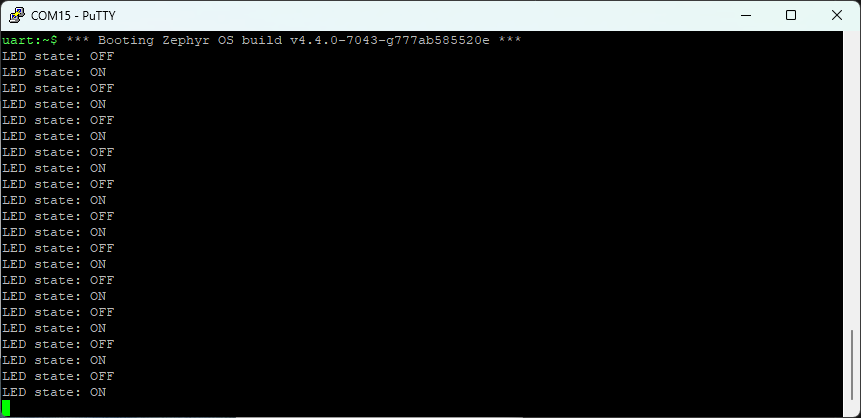
uart:~$ prompt at the top belongs to the old firmware, then the board reboots and starts reporting LED state: instead. Blinky has no shell, so the prompt never comes back. Setting up this serial terminal is covered in Build, flash, connect; you do not need it yet.Note the extension. The runner above flashed zephyr.hex, because STM32CubeProgrammer prefers hex and reads the load address out of the file. The mass-storage route needs the .bin, because a raw binary carries no address information and the bootloader simply assumes the start of flash.
This raises the obvious question of how you would know if it had failed, given that a successful program and a rejected one both end with your file gone. The answer is that this style of bootloader reports errors by writing a file back at you: if the programming fails, a
FAIL.TXT appears on the drive with a one-line reason inside it. So the check after a drag-and-drop is not "is my file still there", which is always no, but "is there a FAIL.TXT", which should also be no. A drive holding nothing but DETAILS.TXT and MBED.HTM is a clean result.One warning about testing this, because it is easy to fool yourself, and I nearly did. If you drag blinky onto a board that is already running blinky, a working programmer and a completely dead one produce an identical blinking LED. The test proves nothing, and it feels like it proved everything.
To make it mean something, put something visibly different on the board first and then watch it be replaced. That is what the capture above does: the board was running the four-thread demo from the rest of this article, complete with its interactive shell, and after the copy it is running blinky and printing
LED state: with no shell at all. There is no way to fake that. A dead programmer leaves the shell exactly where it was. When you test whether a thing works, ask what a broken version would have looked like. If the answer is "the same", you have not run a test yet.The project: a scheduler you can see
Blinky proven, here is the full project. We are going to use real GPIOs with external monitoring to ensure that everything runs exactly as expected. There are four threads, four GPIO pins on the Arduino header, with one probe wire each:
Ground the analyser to any GND pin on the header and clip channels onto D2 to D5. If you have a fifth channel spare, put it on PC13 (the button, reachable on the morpho header): it costs little effort now and we will use it to measure interrupt latency later.
Before the code, the three scheduling ideas the demo exists to demonstrate. If get these, you know more about RTOS behaviour than many:
- Priorities: lower number wins. A Zephyr thread's priority is a small integer, and numerically lower means more urgent, so our priority-1
responderoutranks every other thread we write. (Negative priorities exist too: those threads are cooperative, meaning they cannot be pre-empted at all. Our four application threads stay in the non-negative, pre-emptible range, though as the shell will shortly reveal, the kernel has already put a cooperative thread in your system without asking.) - Equal priorities share via timeslicing.
busy_aandbusy_bboth have priority 5 and both want the CPU at the same instant. WithCONFIG_TIMESLICE_SIZE=10, the kernel gives each a 10 ms slice in turn. On the analyser this appears as alternating 10 ms blocks of activity on D2 and D3, which is round-robin scheduling drawn for you using silicon. - Interrupts hand work to threads. The button triggers an interrupt handler, and interrupt handlers must be short: no sleeping, no printing, no real work. The pattern, used constantly in real firmware, is for the handler to give a semaphore and return; a dedicated thread blocked on that semaphore wakes and does the work at whatever priority it deserves. Here that thread is the highest-priority one in the system, so the burst on D5 begins within microseconds of the press, regardless of what the busy threads were doing.
k_sem_give() adds one to the count, k_sem_take() removes one, and a thread that tries to take from a count of zero is put to sleep until somebody gives. That is exactly why it suits this job: the handler only has to increment a number, which is quick and safe to do inside an interrupt, and the waiting thread does the slow part afterwards at its own priority. Ours is declared K_SEM_DEFINE(button_sem, 0, 1), so it starts empty and counts no higher than one, which means presses arriving while the responder is still working collapse into a single wake-up rather than queueing up.The project: in simulation
Watching the scheduler decide
Four threads, one CPU, and a set of rules that produces behaviour almost nobody predicts correctly. Every trace here is computed from the same three scheduling rules, not drawn by hand, and it lands on the numbers the logic analyser recorded.
Both workers ask for the same thing: 30 milliseconds in which to toggle a pin. Each sets its
deadline with k_uptime_get() + 30, which is a wall-clock deadline, and wall-clock
time keeps passing while the other thread is running. Watch the two bars below the trace: the grey one
is the window each thread asked for, and the coloured one is the CPU it is actually getting.
Now add the ticker, which outranks both workers and pre-empts whichever one is running. The question
every diagram of round-robin scheduling gets wrong is what happens to the interrupted thread's
timeslice. Zephyr calls z_time_slice_reset() on every switch-in, so the worker does not
resume with the remainder of its slice. It resumes with a whole new one.
The ticker runs on its own clock, and nothing keeps it aligned with the workers' 100 ms wake. Drag the slider to move where its pulse falls. The mechanism never changes, and yet the block you would bracket with cursors moves between 10 ms and 20 ms, and the active window between 39 ms and 50 ms. This is why two captures of the same firmware can disagree.
| Ticker phase | Active span | Longest busy_a block | busy_a CPU | busy_b CPU |
|---|
A different time scale entirely. Everything above is measured in milliseconds; the whole of this is over in less than thirty microseconds, which is under one pixel of the captures above. The interrupt handler does almost nothing: it gives a semaphore and returns, and the priority-1 responder wakes and does the work.
The devicetree overlay
The board's devicetree already names the LED (led0, which is LD2 on PA5) and the button (sw0, B1 on PC13). Our four probe pins are our own invention, so we declare them in an application overlay, a fragment merged over the board's devicetree at build time. The conventional home for application-specific properties that no driver claims is the zephyr,user node.
Create the project as a sibling of the samples, with this shape:
een-nucleo-rtos
│   CMakeLists.txt
│   prj.conf
├───boards
│       nucleo_f401re.overlay
└───src
        main.c
boards/nucleo_f401re.overlay:
/*
 * Four "probe" pins for a logic analyser, on the Arduino header where they
 * are easy to reach. The zephyr,user node is the conventional home for
 * application-specific devicetree properties that no driver claims.
 *
 *   probe-a  D2  PA10   busy worker A (priority 5)
 *   probe-b  D3  PB3    busy worker B (priority 5)
 *   probe-c  D4  PB5    periodic ticker (priority 3)
 *   probe-d  D5  PB4    button responder (priority 1)
 */
/ {
	zephyr,user {
		probe-a-gpios = <&gpioa 10 GPIO_ACTIVE_HIGH>;
		probe-b-gpios = <&gpiob 3 GPIO_ACTIVE_HIGH>;
		probe-c-gpios = <&gpiob 5 GPIO_ACTIVE_HIGH>;
		probe-d-gpios = <&gpiob 4 GPIO_ACTIVE_HIGH>;
	};
};
Because the overlay lives in a boards/ directory and is named after the board target, west picks it up automatically. To port this project to another board you would add, say, boards/xiao_ble.overlay with that board's four spare pins, and touch nothing else.
.dts file and you will find that LD2's pin, PA5, is also SPI1's clock and Arduino pin D13, a sharing arrangement inherited from the original Arduino Uno layout. Your code neither knows nor cares: it asks for led0 and the devicetree resolves the rest. When we build for a board whose LED is wired active-low (the XIAO, for instance), the GPIO_ACTIVE_LOW flag in its devicetree inverts the electrical level automatically, and the same C code still just says "LED on".The configuration
prj.conf:
# --- Hardware we touch ---
CONFIG_GPIO=y               # the LED, the button, and the four probe pins

# --- Make the scheduler's behaviour observable ---
# Threads of EQUAL preemptive priority share the CPU in round-robin slices.
# 10 ms slices are long enough to see as alternating blocks on a logic
# analyser, short enough that the demo still feels instant.
CONFIG_TIMESLICING=y
CONFIG_TIMESLICE_SIZE=10
# The MOST URGENT priority that gets sliced. 0 means "slice every
# preemptible thread"; raise it to protect urgent threads from being
# interrupted by an equal-priority peer.
CONFIG_TIMESLICE_PRIORITY=0

# --- Introspection: a shell over the ST-LINK virtual COM port ---
# `kernel thread list` prints every thread with its priority, state and
# stack use; `kernel uptime` and `kernel version` also come from KERNEL_SHELL.
CONFIG_SHELL=y
CONFIG_KERNEL_SHELL=y
CONFIG_THREAD_NAME=y
CONFIG_THREAD_MONITOR=y
CONFIG_THREAD_STACK_INFO=y
# Adds a CPU-usage column to `kernel thread list`, which lets us check the
# analyser's picture against the kernel's own accounting.
CONFIG_THREAD_RUNTIME_STATS=y
Three things deserve a comment:
CONFIG_TIMESLICE_SIZEis the important entry: set it to 0 later and watch what happens to the two busy threads (spoiler in the experiments section). Its neighbourCONFIG_TIMESLICE_PRIORITYis less obvious and worth knowing about, because it is the escape hatch. It names the most urgent priority level that timeslicing applies to, so0means every preemptible thread is fair game. Set it to5and threads at priorities 0 to 4 are exempt: they run until they block, even against an equal-priority peer. That is what you want for a thread doing something that must not be chopped in half.CONFIG_THREAD_RUNTIME_STATScosts a little RAM and buys a CPU-usage percentage per thread in the shell. It matters here because it gives you a second, independent measurement of the same behaviour the analyser shows: the traces tell you when each thread ran, and the shell tells you how much of the CPU each one got in total. When two instruments that work in completely different ways agree, you have understood something.- Finally, the shell block costs about 20 KB of flash and gives you a live command line into the kernel over the same USB cable, which for a learner is worth ten textbooks.
The code
src/main.c, complete. If the brace placement looks unfamiliar, Zephyr follows the Linux kernel style (braces on the same line for control flow, on their own line for functions, tabs of eight); I keep to it so the code reads like the Zephyr tree you will spend time in.
// src/main.c
// "The scheduler on a scope": four threads whose behaviour you can watch
// on a logic analyser, one probe pin each. The pin mapping lives in the
// per-board overlay under boards/ -- this file is board-agnostic.
//
//   probe-a  busy_a     priority 5   toggles as fast as it can
//   probe-b  busy_b     priority 5   identical twin of busy_a
//   probe-c  ticker     priority 3   1 ms pulse every 25 ms
//   probe-d  responder  priority 1   pulse burst on a button press
//   led0                             toggled by the responder
//
// What the traces show:
//   * A and B have EQUAL priority, so with CONFIG_TIMESLICE_SIZE=10 the
//     kernel round-robins them: the analyser shows alternating 10 ms
//     blocks of activity on D2 and D3. Each thread therefore gets only
//     about HALF the CPU inside the wall-clock window it asked for --
//     see busy_worker() below, and the "What the analyser shows" section.
//   * The ticker has HIGHER priority (lower number), so its 1 ms pulse
//     punches a 1 ms gap into whichever busy thread was running.
//   * The button gives a semaphore from an interrupt handler; the
//     responder is the highest-priority thread we define, so its burst
//     pre-empts the others almost instantly after the press.

#include <zephyr/kernel.h>
#include <zephyr/drivers/gpio.h>
#include <zephyr/sys/printk.h>
#include <zephyr/version.h>

// --- Devicetree: the board gives us the LED and button by alias; the four
// --- probe pins come from the zephyr,user node in our overlay.
static const struct gpio_dt_spec led = GPIO_DT_SPEC_GET(DT_ALIAS(led0), gpios);
static const struct gpio_dt_spec button = GPIO_DT_SPEC_GET(DT_ALIAS(sw0), gpios);
static const struct gpio_dt_spec probe_a =
	GPIO_DT_SPEC_GET(DT_PATH(zephyr_user), probe_a_gpios);
static const struct gpio_dt_spec probe_b =
	GPIO_DT_SPEC_GET(DT_PATH(zephyr_user), probe_b_gpios);
static const struct gpio_dt_spec probe_c =
	GPIO_DT_SPEC_GET(DT_PATH(zephyr_user), probe_c_gpios);
static const struct gpio_dt_spec probe_d =
	GPIO_DT_SPEC_GET(DT_PATH(zephyr_user), probe_d_gpios);

// --- The busy workers: equal priority, so they demonstrate timeslicing.
// Each wakes at the same absolute instant (a multiple of PERIOD_MS), spends
// a BUSY_MS WINDOW toggling its probe pin flat out, then sleeps until the
// next period. Because both are ready at the same tick and neither ever
// blocks while working, only the scheduler's round-robin timeslice decides
// who runs -- which is exactly what we want to see.
#define PERIOD_MS      100
#define BUSY_MS        30
#define TOGGLE_BATCH   64

// Threads must not touch their probe pins until main() has configured them
// as outputs. Right now main's priority (0) happens to beat theirs, so it
// finishes first anyway -- but relying on that is exactly the kind of
// accident that breaks when someone changes a priority. The start delay
// makes the ordering explicit. Absolute-time sleeps mean the delay costs
// nothing: both workers still re-align on the same 100 ms boundary.
#define START_DELAY_MS 50

static void busy_worker(void *p1, void *p2, void *p3)
{
	const struct gpio_dt_spec *probe = p1;
	int64_t next_wake = 0;

	while (true) {
		k_sleep(K_TIMEOUT_ABS_MS(next_wake));

		// NOTE this is a WALL-CLOCK deadline, and deliberately so.
		// The 30 ms keeps elapsing while the *other* worker holds the
		// CPU, so each thread ends up with roughly half of it. That
		// difference between elapsed time and CPU time is the whole
		// lesson; see "What the analyser shows".
		int64_t deadline = k_uptime_get() + BUSY_MS;

		while (k_uptime_get() < deadline) {
			// Batch the toggles. k_uptime_get() costs far more than
			// gpio_pin_toggle_dt(), so checking the clock on every
			// edge would make the pin an order of magnitude slower
			// than the "flat out" this is meant to represent.
			for (int i = 0; i < TOGGLE_BATCH; i++) {
				gpio_pin_toggle_dt(probe);
			}
		}
		next_wake += PERIOD_MS;
	}
}

K_THREAD_DEFINE(busy_a, 1024, busy_worker, (void *)&probe_a, NULL, NULL, 5, 0,
		START_DELAY_MS);
K_THREAD_DEFINE(busy_b, 1024, busy_worker, (void *)&probe_b, NULL, NULL, 5, 0,
		START_DELAY_MS);

// --- The ticker: higher priority than the busy workers. k_busy_wait()
// spins without yielding, so the 1 ms pulse is 1 ms of stolen CPU -- the
// gap it leaves in the busy workers' waveforms is pre-emption made visible.
static void ticker_fn(void *p1, void *p2, void *p3)
{
	while (true) {
		k_sleep(K_MSEC(24));
		gpio_pin_set_dt(&probe_c, 1);
		k_busy_wait(1000);
		gpio_pin_set_dt(&probe_c, 0);
	}
}

K_THREAD_DEFINE(ticker, 1024, ticker_fn, NULL, NULL, NULL, 3, 0,
		START_DELAY_MS);

// --- The responder: the classic interrupt-to-thread pattern. The button's
// interrupt handler must be short (no sleeping, no slow work), so it only
// gives a semaphore. The responder thread, blocked on that semaphore, does
// the actual work at the highest priority in the application.
static K_SEM_DEFINE(button_sem, 0, 1);

static void button_pressed(const struct device *dev, struct gpio_callback *cb,
			   uint32_t pins)
{
	static int64_t last_ms;
	int64_t now = k_uptime_get();

	// Crude debounce: ignore edges within 200 ms of the last accepted one.
	if (now - last_ms > 200) {
		last_ms = now;
		k_sem_give(&button_sem);
	}
}

static void responder_fn(void *p1, void *p2, void *p3)
{
	while (true) {
		k_sem_take(&button_sem, K_FOREVER);
		gpio_pin_toggle_dt(&led);
		for (int i = 0; i < 5; i++) {
			gpio_pin_set_dt(&probe_d, 1);
			k_busy_wait(500);
			gpio_pin_set_dt(&probe_d, 0);
			k_busy_wait(500);
		}
		printk("button: burst sent, LED toggled\n");
	}
}

K_THREAD_DEFINE(responder, 1024, responder_fn, NULL, NULL, NULL, 1, 0, 0);

// --- main() configures the pins and the button interrupt, prints a banner,
// and then RETURNS. That is fine: main is just another thread in Zephyr,
// and the four K_THREAD_DEFINE threads above keep running without it.
static struct gpio_callback button_cb;

static int configure_output(const struct gpio_dt_spec *spec, const char *name)
{
	if (!gpio_is_ready_dt(spec)) {
		printk("error: %s not ready\n", name);
		return -ENODEV;
	}
	return gpio_pin_configure_dt(spec, GPIO_OUTPUT_INACTIVE);
}

int main(void)
{
	printk("=== scheduler-on-a-scope: Zephyr %s on %s ===\n",
	       KERNEL_VERSION_STRING, CONFIG_BOARD);

	configure_output(&led, "led0");
	configure_output(&probe_a, "probe-a");
	configure_output(&probe_b, "probe-b");
	configure_output(&probe_c, "probe-c");
	configure_output(&probe_d, "probe-d");

	if (!gpio_is_ready_dt(&button)) {
		printk("error: button not ready\n");
		return 0;
	}
	gpio_pin_configure_dt(&button, GPIO_INPUT);
	gpio_pin_interrupt_configure_dt(&button, GPIO_INT_EDGE_TO_ACTIVE);
	gpio_init_callback(&button_cb, button_pressed, BIT(button.pin));
	gpio_add_callback(button.port, &button_cb);

	printk("probes A-D and the button are mapped in boards/%s.overlay\n",
	       CONFIG_BOARD);
	printk("press the button; try `kernel thread list` in the shell\n");

	return 0;
}
And the two-line CMakeLists.txt that turns the directory into a Zephyr application:
cmake_minimum_required(VERSION 3.20.0)
find_package(Zephyr REQUIRED HINTS $ENV{ZEPHYR_BASE})
project(nucleo_rtos_scope LANGUAGES C)

target_sources(app PRIVATE src/main.c)
A few things in the listing need a second look:
K_THREAD_DEFINEcreates threads at compile time. Nomain()involvement: the kernel readies all four beforemain()even runs. The arguments are name, stack size in bytes, entry function, threevoid *parameters, priority, options, and start delay. Passing&probe_aas a parameter is how the two busy workers share one function.k_sleep(K_TIMEOUT_ABS_MS(...))sleeps until an absolute time, not for a duration. Both busy workers therefore wake on exactly the same tick, every 100 ms, which is what forces the scheduler to arbitrate between them. Relative sleeps would slowly drift apart and the round-robin pattern would degrade.k_busy_wait()versusk_sleep()is the difference between hogging the CPU and giving it back. The busy workers and the ticker usek_busy_wait(or a spin loop) deliberately, because we want them to compete for the CPU. In production firmware you sleep; in this article, hogging is important for the demonstration.main()returns and nothing stops. In Zephyr,mainis simply a thread the kernel starts for you; when it returns, its stack is reclaimed and the application continues. Beginners from the Arduino world, where leavingloop()is unthinkable might find this strange.
main() executes, and main() is the function that configures the probe pins those threads immediately start toggling.The demo works anyway, and the reason is worth discussing.
main() is a thread too, running at CONFIG_MAIN_THREAD_PRIORITY, which defaults to 0, which is more urgent than the ticker at 3 and the workers at 5. So main() runs to completion first, and by the time any worker sees the CPU, its pin is an output. The ordering that keeps this program correct is a priority accident, not a guarantee.That is why the
START_DELAY_MS argument is there. It has no cost (the absolute-time sleep re-aligns both workers on the next 100 ms boundary regardless) and it turns an accident into a statement. So, statically defined threads can run before your initialisation does, which means you either order them explicitly or do the initialisation somewhere the kernel guarantees runs first, such as a SYS_INIT hook. The failure mode if you get it wrong is a pin that does nothing, which is far harder to find.last_ms, and only the responder thread touches probe_d and the LED. Deciding which thread owns which state is the discipline that keeps multithreaded firmware sane, and it is worth practising even in a demo this small. The moment two threads write the same variable, you need the kernel's synchronisation tools (the semaphore here is the first of them) rather than hope.Build, flash, connect
west build -b nucleo_f401re een-nucleo-rtos -d build-nucleo
The build ends with the memory report, and it is worth noting:
Memory region         Used Size  Region Size  %age Used
           FLASH:       48716 B       512 KB      9.29%
             RAM:       13824 B        96 KB     14.06%
           SRAM0:           0 B        96 KB      0.00%
        IDT_LIST:           0 B        32 KB      0.00%
An entire operating system (scheduler, driver model, GPIO and UART drivers, an interactive shell) plus our application, in 48 KB of flash and 14 KB of RAM. Set that beside blinky's 17,296 bytes from earlier and the arithmetic is informative: four threads, a semaphore, a button interrupt and five GPIOs account for almost none of the difference. Practically the whole of that extra 31 KB is the shell.
ninja: no work to do. and no memory report is not a failure. Run west build twice in a row and the second run prints that line and nothing else. The report you are reading here is produced by the link step, so when nothing needs relinking there is no report to print. It means your build is already current.It does become confusing when you expected a rebuild and did not get one, usually after editing a file outside the source tree or pulling new Zephyr commits. Two ways to be certain:
west build -d build-nucleo -t rom_report breaks the flash usage down symbol by symbol without needing a rebuild at all, or add --pristine to start from nothing, at the cost of a full recompile. The --pristine discussion earlier in this article covers when you genuinely need the second one. This footprint is why Zephyr scales down to sensors that run for years on coin cells.For a sense of how much of that is the shell rather than the kernel, compare it with a build I measured on a different board in the vanilla Zephyr article of my UNO Q series. That one carries the same pre-emptive kernel plus a display driver running a 104-pixel scan from a timer interrupt, plus a sensor subsystem, and comes in at 32,188 bytes of flash and 4,944 bytes of RAM, which is considerably smaller than this one despite doing more, because it never asked for a shell. Two real builds, same RTOS, and the difference between them is almost entirely one CONFIG_ line. That is the point of Kconfig in a single comparison: you pay for what you ask for, and nothing else.
Flash it (west flash -d build-nucleo, or drag build-nucleo\zephyr\zephyr.bin onto the NOD_F401RE drive), then open a serial terminal on the ST-LINK's virtual COM port at 115200 baud, 8N1. On Linux that is screen /dev/ttyACM0 115200. On Windows it is PuTTY on the port that appears in Device Manager as "STMicroelectronics STLink Virtual COM Port", and rather than hunting through the list you can ask for it directly:
Get-PnpDevice -Class Ports -Status OK |
    Where-Object InstanceId -like 'USB\VID_0483&PID_374B*' |
    Select-Object FriendlyName
FriendlyName
------------
STMicroelectronics STLink Virtual COM Port (COM15)
0483 is STMicroelectronics and 374B is the ST-LINK/V2-1, so that filter finds the board and ignores everything else plugged in. The number in brackets is what you type into PuTTY, and it will likely not be COM15 on your machine. Expect it to move if you use a different USB socket.
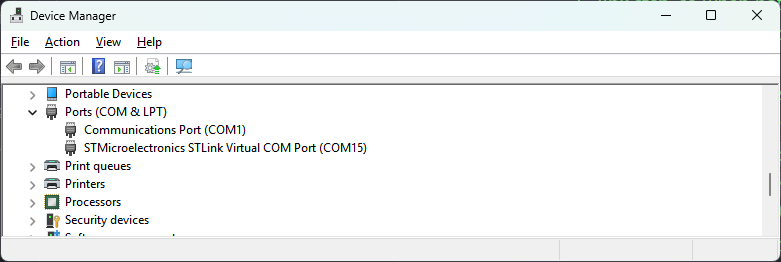
COM15 here; yours will differ.Press reset and you should see the banner, and pressing Enter gives you a uart:~$ prompt.
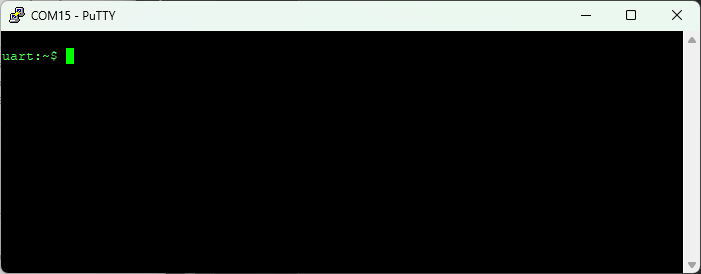
uart:~$ prompt and nothing above it. The shell is working perfectly. See the box below.main() a few microseconds after boot, and the board boots the instant west flash finishes, long before you have PuTTY open. By the time you attach, that text has been and gone: a UART has no scrollback, and nothing is buffered on the board waiting for a reader to appear. Press Enter and the shell draws a prompt, which makes the emptiness above it look like a failure rather than simply the past. Press the black reset button (B2) with the terminal already open and the whole sequence appears:*** Booting Zephyr OS build v4.4.0-7043-g777ab585520e ***
=== scheduler-on-a-scope: Zephyr 4.4.99 on nucleo_f401re ===
probes A-D and the button are mapped in boards/nucleo_f401re.overlay
press the button; try `kernel thread list` in the shell
uart:~$
The first line is Zephyr's own, from
CONFIG_BOOT_BANNER, and it is a useful one to recognise: it tells you the kernel reached the end of its own initialisation, so anything missing after it is your application's fault rather than the system's. The three that follow are the printk calls in main(). Since the reset button is right there, get into the habit of opening the terminal first and resetting second. It is also the reason printk alone is a poor debugging strategy on a board like this, and part of why the shell in the next section is worth its 31 KB: a shell you can interrogate at any moment does not care whether you were watching at boot.
uart:~$ prompt at the top: the board has restarted, but your terminal has not, and it simply carries on writing where it left off.Why the banner says nucleo_f401re while the build output said nucleo_f401re/stm32f401xe. Both are correct, and they are different symbols. Modern Zephyr splits a board into a name and one or more qualifiers identifying the SoC, core or variant being targeted, so this build carries all of:
CONFIG_BOARD="nucleo_f401re"
CONFIG_BOARD_QUALIFIERS="stm32f401xe"
CONFIG_BOARD_TARGET="nucleo_f401re/stm32f401xe"
Our printk uses CONFIG_BOARD, so it prints the short name; the build system reports CONFIG_BOARD_TARGET. On a single-core part like this one the distinction is cosmetic, but it stops being cosmetic on a multi-core SoC, where board/soc/cpucluster is what tells you which processor you just built for. If you ever want the full string in your own output, use CONFIG_BOARD_TARGET.
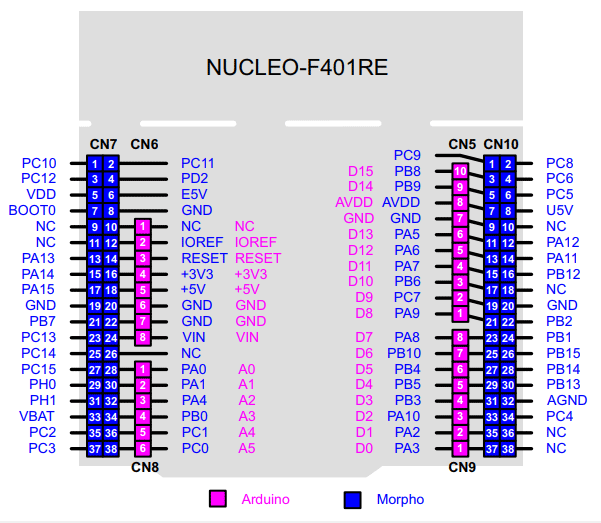
D2 to D5 at the bottom of CN9, and the user button is PC13, twelve rows down CN7 at pin 23. Note that PC13 appears only on the morpho side, which is why the button needs a lead to the inner header rather than a clip on the Arduino row with the others.The pins this article uses, verified against boards/st/nucleo_f401re/arduino_r3_connector.dtsi and st_morpho_connector.dtsi in the Zephyr tree rather than against the pinout diagram:
The button is the one that needs finding. B1 is not brought out to the Arduino header at all, so its pin is only reachable on the left-hand morpho header, and it is active low with a pull-up: a press is a falling edge. You do not need it for the round-robin captures below, only for the interrupt latency measurement at the end.
What the analyser shows
With probes on D2 to D5 and a capture spanning a few hundred milliseconds, you should see the following. Every figure and every number in this section was measured on the board described above; none of it is simulated or estimated.
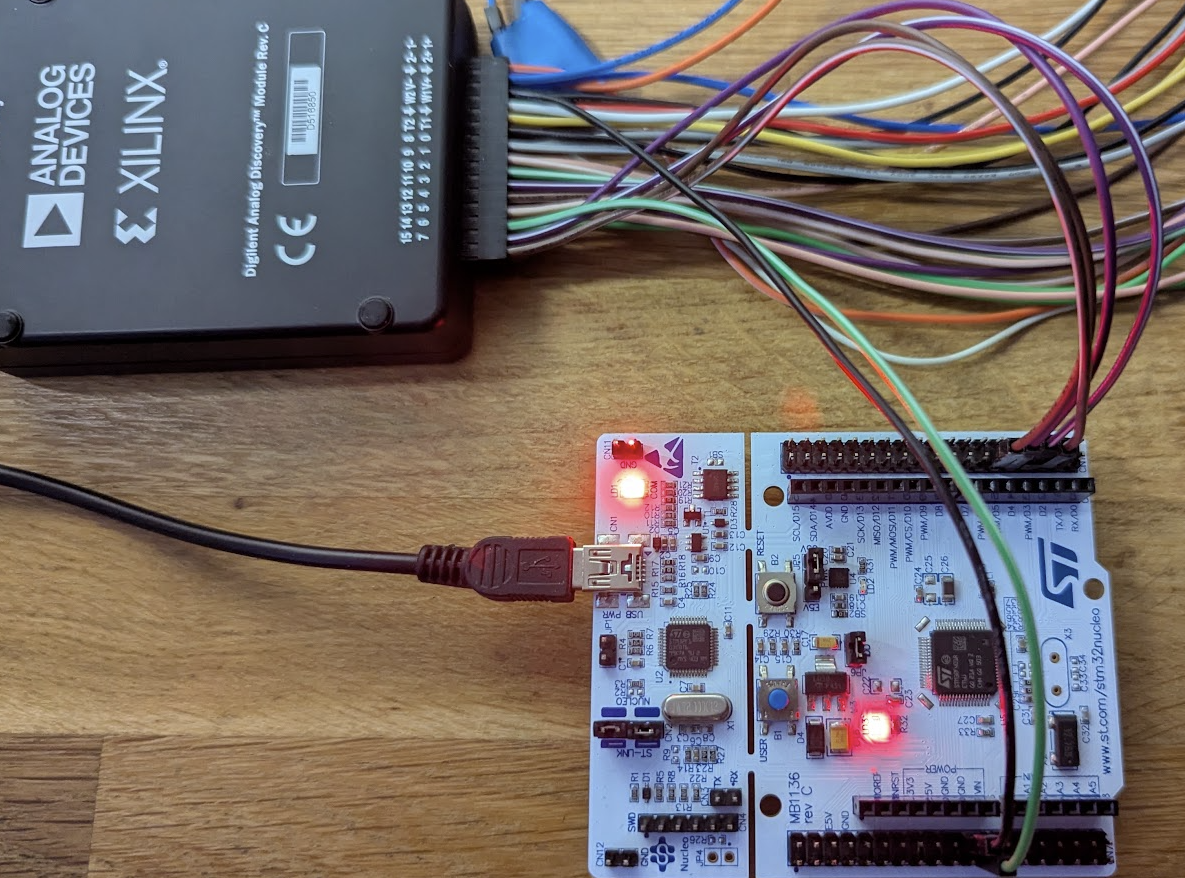
D2 to D5, one ground lead, and a longer lead reaching round to PC13 on the morpho header for the button. The board's only other connection is the Mini-B cable carrying power, programming, debug and console together. Note the two red LEDs: LD1 reporting ST-LINK traffic and LD3 the power rail. The green LD2 is dark, because in this firmware it is toggled only by the button responder, and nobody has pressed anything.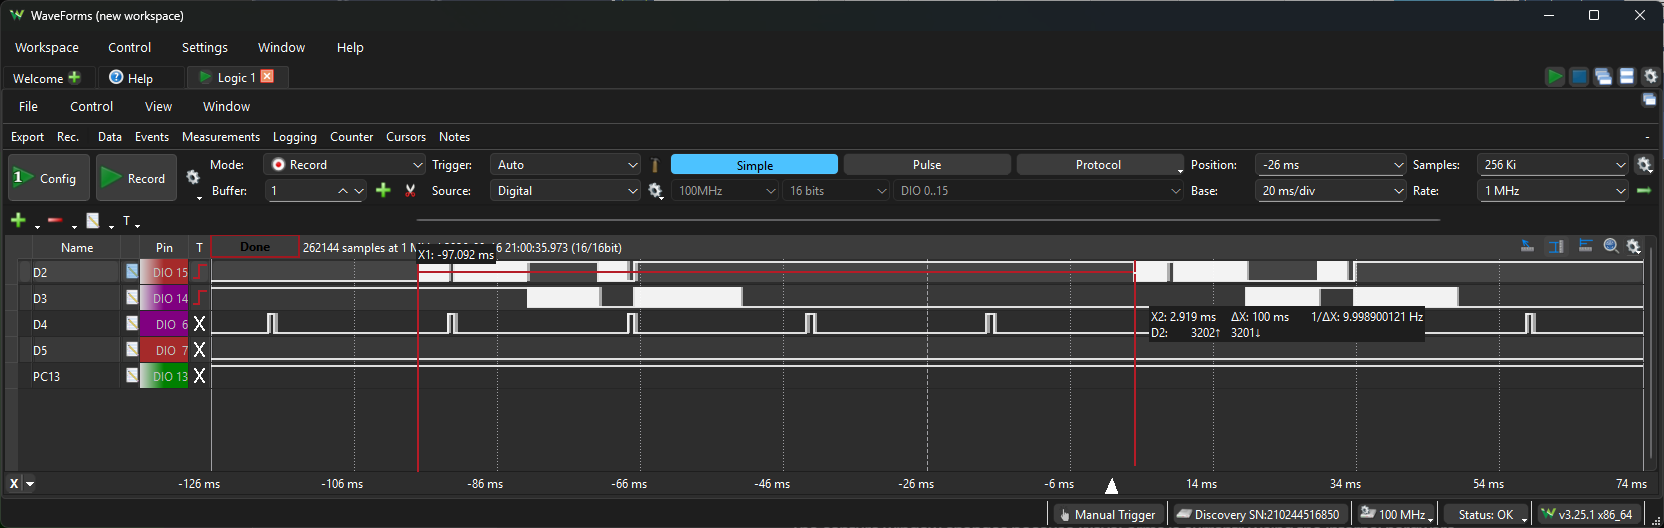
PERIOD_MS. Everything the rest of this section measures is somewhere in this picture.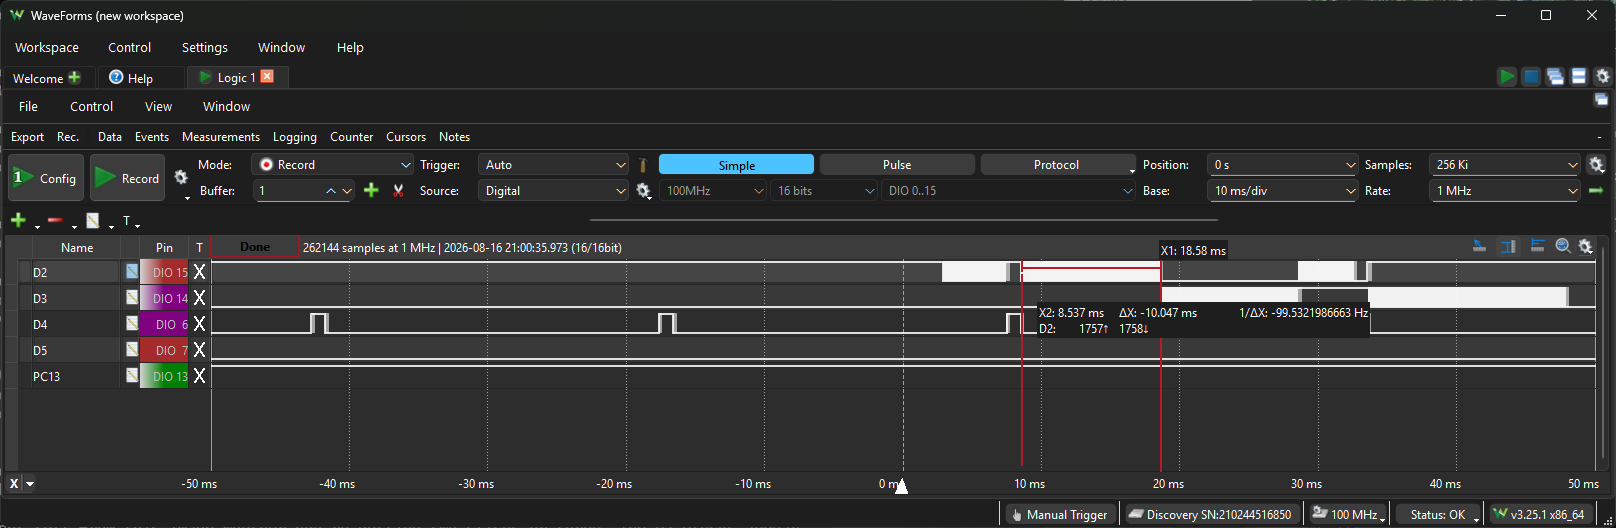
CONFIG_TIMESLICE_SIZE=10 measured to within half a percent. The D2: 1757↑ 1758↓ readout is the edge count within the cursors, and it is used later to work out the notch width without having to measure it directly.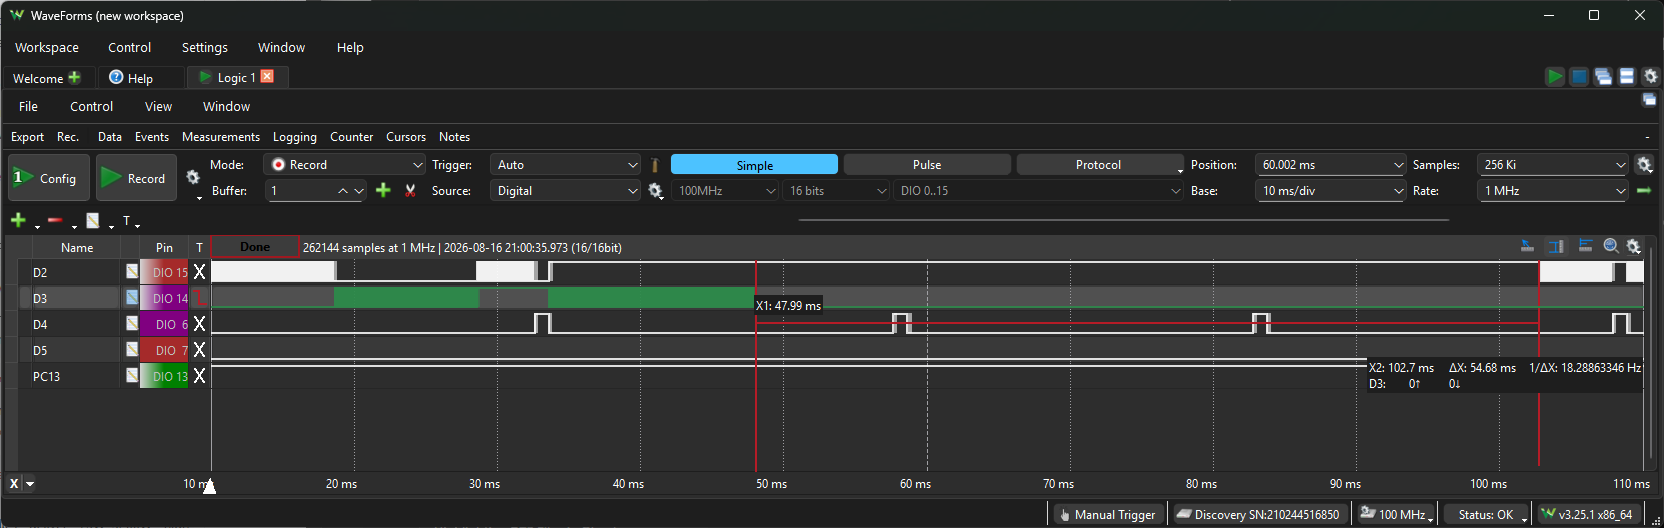
0↑ 0↓ across ΔX = 54.68 ms. Confirming zero edges matters: the active span ends only when both workers stop, so a gap that is quiet on one channel is not yet a gap. Subtracting from the 100 ms period gives an active span of ≈45 ms, not the 40 ms the model below predicts.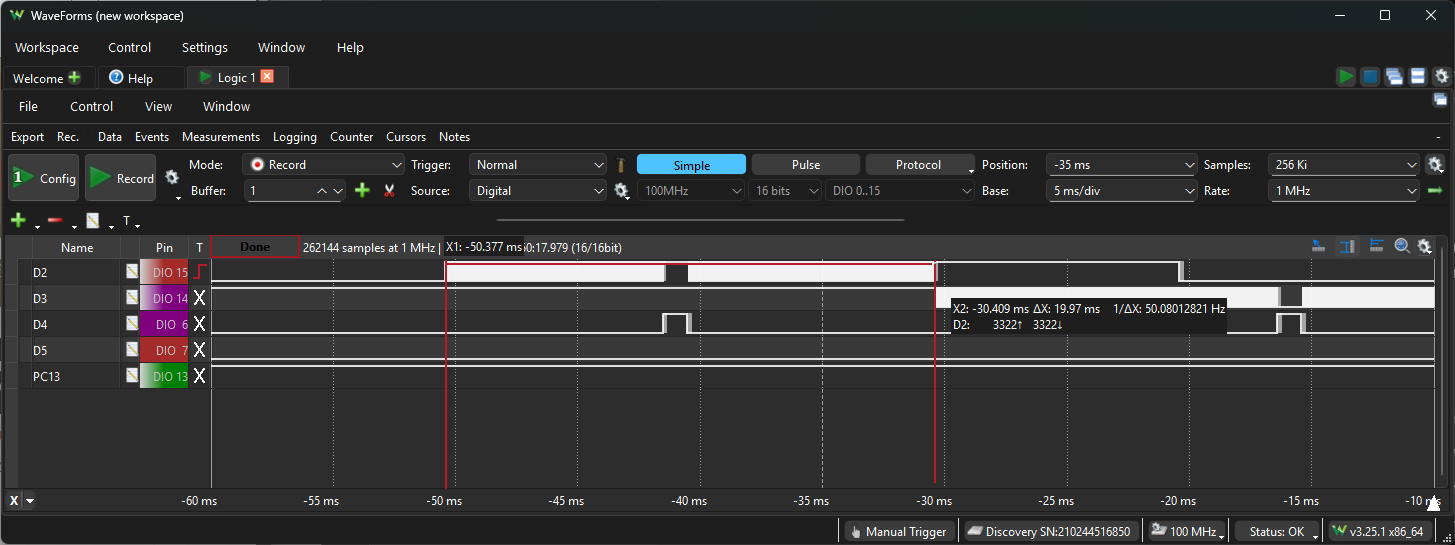
The round-robin. Every 100 ms, D2 and D3 come alive, and they never overlap: A toggles for 10 ms while B is silent, then they swap. That alternation is CONFIG_TIMESLICE_SIZE=10 operating on two equal-priority threads, and zooming in on a boundary lets you measure the slice width yourself.
Four measurements from that capture, all taken with WaveForms cursors rather than by eye:
The period confirms PERIOD_MS, and the slice confirms CONFIG_TIMESLICE_SIZE=10 to within half a percent. The interesting one is the span, because a naive reading of the code expects something else entirely.
Elapsed time is not CPU time, and this trace is the proof. The busy worker sets its deadline with k_uptime_get() + BUSY_MS. That is a wall-clock deadline, and wall-clock time keeps passing while the other thread is running. Each worker asked for 30 ms of work, so the naive expectation is 60 ms of activity per period. Trace it through instead, ignoring the ticker for a moment:
Each thread asked for a 30 ms window and got roughly 20 ms of CPU inside it, because it was sharing. This is the single most common misconception about multithreaded systems, and it is why a "30 ms task" can silently miss a 30 ms deadline the moment a second thread appears at the same priority. On a single core, asking for time and receiving it are different things, and the difference is whatever the scheduler decides.
Confirm it from the kernel rather than from the traces. kernel thread list reports busy_a at 16% and busy_b at 23%, summing to 39% of the CPU. Two threads getting 20 ms each out of every 100 ms would be 40%. The wall-clock argument holds, measured by a mechanism that knows nothing about your analyser.
/* zephyr/kernel/include/kswap.h */z_time_slice_reset(new_thread);Zephyr restarts the timeslice every time a thread is switched in, not only when a slice runs to completion. So a worker interrupted 3 ms into its slice does not resume with 7 ms remaining. It resumes with a fresh 10 ms. The ticker fires about twice inside the active window, and each visit stretches the pattern, which is how 40 ms becomes 45.
That also explains the lopsided CPU split, which is not measurement noise: 16% and 23% came back identical across a reflash and a reboot. B's wall-clock deadline is set later than A's, because B does not start until A's first slice ends, and every ticker pre-emption pushes B's finish out further still. B always finishes last, and it is paid for the privilege.
You can measure the reset happening. Compare two blocks from the same capture. An undisturbed one runs for 10.047 ms, one timeslice. A block with a ticker pulse inside it runs for 19.97 ms. If the worker had merely lost the ticker's 1 ms and kept the rest of its slice, that second block would have measured 11 ms. Instead the ticker arrived about 9.5 ms in, and the worker came back with a full slice in hand: 9.5 + 1 + 10 comes to 20.5 ms, against 19.97 measured. Doubling a thread's run because something more urgent briefly interrupted it is not intuitive, and it is not in any diagram of round-robin scheduling you will find.
The honest summary is that the clean five-row table is a good model and a wrong prediction. It gets the mechanism right and the number wrong, and you only find out which by measuring. That is the entire argument for putting probes on a board rather than reasoning about a scheduler in your head.
The pre-emption notches. D4 carries a clean 1 ms pulse roughly every 25 ms. Whenever one lands inside the busy window, the running busy thread's toggling stops for exactly the width of that pulse and resumes afterwards. The priority-3 ticker does not ask permission: the kernel suspends the priority-5 thread mid-loop, runs the ticker, and hands the CPU back. That silence on D2 or D3, shaped exactly like the pulse on D4, is pre-emption.
You can check the equality without placing a single cursor on the notch, which is worth doing because a notch that narrow is hard to bracket accurately. Use the analyser's edge counter instead. The uninterrupted 10.047 ms block carried 1757 rising edges, so the worker toggles at 174.9 edges per millisecond. The interrupted 19.97 ms block carried 3322. Divide:
3322 ÷ 174.9  = 19.00 ms   <- time actually spent toggling
19.97 − 19.00 =  0.97 ms   <- time spent stopped
0.97 ms of silence, against the k_busy_wait(1000) in ticker_fn. The notch is the ticker, to within 3%.
That the toggle rate comes out the same in both blocks, 174.9 and 175.1 edges per millisecond, is worth noticing too. It says the worker's inner loop runs at a constant rate whether or not it is being interrupted, which is what you would hope, and it means neither measurement is being distorted by the 1 MHz sampling. Counting edges is often a better instrument than measuring times: the count is exact, where a cursor is only as good as your zoom level. If you would rather not take the arithmetic on trust, the direct version is a capture at 10 MHz and 200 µs/div triggered on D4's rising edge, where the pulse and the notch can both be bracketed with cursors.
How fast is "flat out", actually? That question has been hanging over the last two paragraphs, because all of it rests on an edge count taken at 1 MHz, and a signal faster than half the sample rate would produce a plausible-looking count that was quietly wrong. It is also the sort of thing worth knowing for its own sake. Change one instrument setting and you can see individual toggles: 100 MHz, 4 µs/div, triggered on D2 rising. The workers are busy 45 ms in every 100, so the trigger fires almost at once.
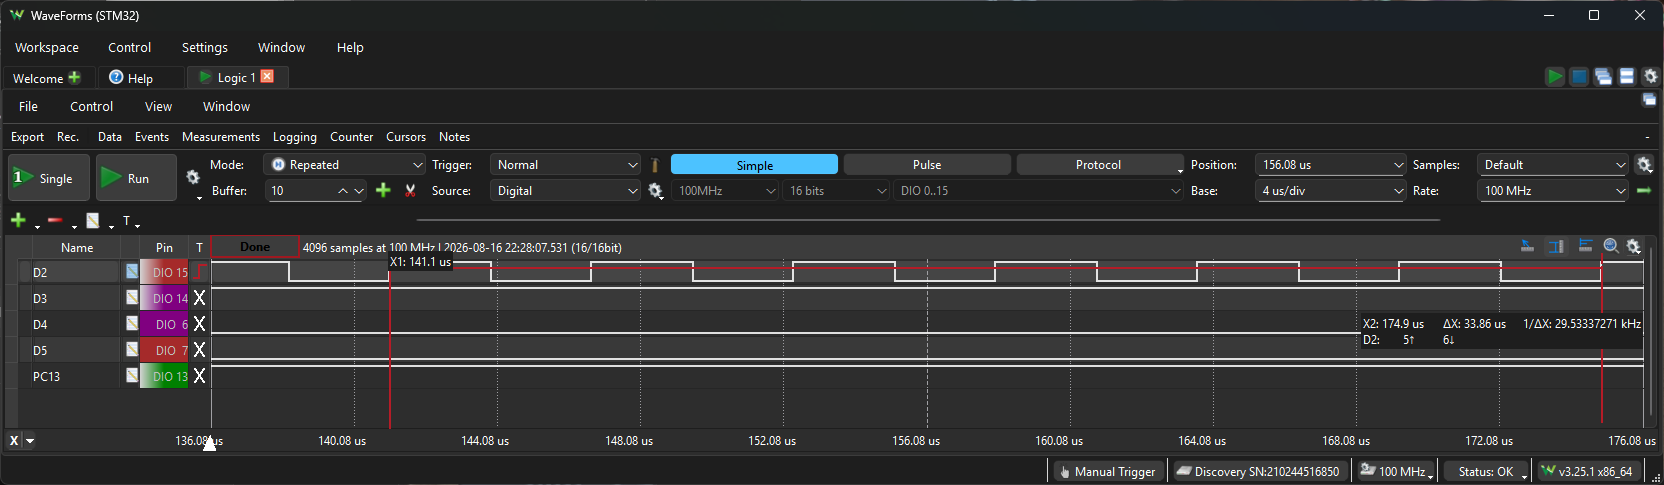
Two useful numbers fall out. First, the earlier 1 MHz counts are vindicated: 1757 rising edges in 10.047 ms works out at 5.72 µs per cycle, against 5.64 µs measured directly here. Agreement to 1.4% means the sampling was resolving the signal properly, and the notch arithmetic above is sound.
Second, and more surprising, one cycle is two calls to gpio_pin_toggle_dt(), so a single GPIO toggle costs about 2.8 µs. On an 84 MHz Cortex-M4 that is roughly 240 clock cycles to flip one pin. "Flat out" turns out to mean about 88 kHz, not the megahertz you might picture, and the reason is the road the call takes: gpio_pin_toggle_dt() resolves to gpio_pin_toggle(), which calls gpio_port_toggle_bits(), which dispatches through a function pointer into the STM32 driver, which finally does a read-modify-write on the port register. None of it is inlined, and at 84 MHz the flash needs wait states to keep up with the instruction fetch.
That is not a criticism of Zephyr, it is the price of the driver model that lets this same file build for three different boards. But it is worth carrying forward, because it is exactly the kind of cost that stays invisible until you put a probe on it, and it becomes relevant again in the button measurement below.
The button. Press B1 and D5 emits five clean 0.5 ms pulses while LD2 toggles, and it does so even if you press during the busy window, because priority 1 beats the workers and the ticker alike. This is the measurement worth taking properly, and it needs a different capture from everything above: leave Record mode, set the rate to 50 MHz or more, trigger on the falling edge of PC13, and use about 8 µs/div. The whole event is over in 30 microseconds, so a capture built for a 400 ms window cannot see it.
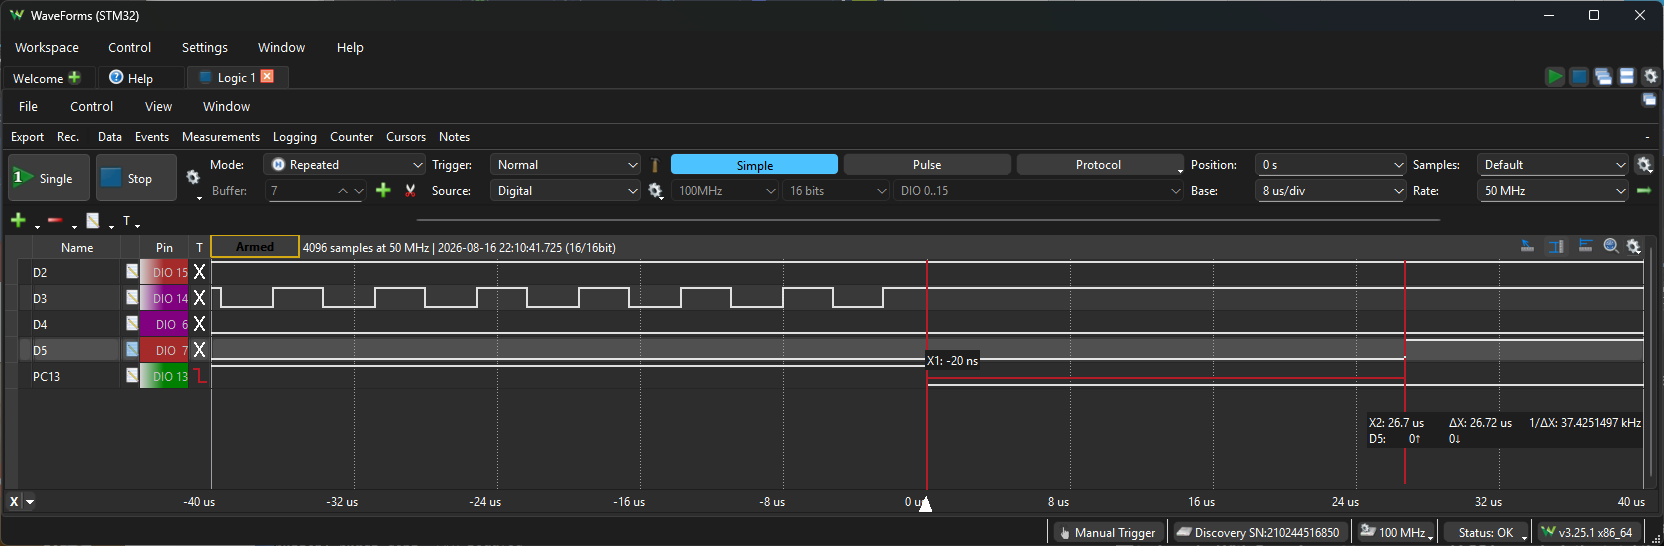
PC13 falls at the trigger, D5 rises 26.72 µs later, and D3 stops toggling in between as the priority-5 worker is pre-empted by the priority-1 responder. The D5: 0↑ 0↓ readout confirms the cursors bracket the interval cleanly, with the first output edge exactly at X2.Then measure from PC13's falling edge to D5's first rising edge, over ten or so presses. Eleven of mine:
Report the maximum, not the average. On a real-time system the typical case is a comfort and the worst case is the specification, and the entire reason for choosing a pre-emptive kernel is to put a bound on that number rather than to make the common case quick.
It is not pure scheduler latency. Look at
responder_fn: before the loop that drives D5, it calls gpio_pin_toggle_dt(&led). So the interval you just measured contains the interrupt entry, the callback, the semaphore, the context switch, and an entire LED write that has nothing to do with the handover. It is a full end-to-end number, "press to first visible output", but it is not the kernel's number. If you want the clean figure, move the LED toggle below the burst and measure again.We can put a size on that, though, because the previous section measured a GPIO toggle at 2.8 µs. So the LED accounts for roughly 11% of the 26 µs, and the interrupt-to-thread path itself is around 23 µs, or some 1,900 clock cycles from an electrical edge on a pin to application code running in a different thread. That covers hardware interrupt entry, Zephyr's ISR wrapper, the GPIO driver walking its callback list,
k_sem_give(), the scheduler deciding a priority-1 thread now outranks the priority-5 one it interrupted, and a full context switch through PendSV. Put like that, 23 µs starts to look less like overhead and more reasonable.It is not noise. Sort the eleven readings and they do not scatter, they cluster: four near 23.5 µs, three at exactly 25.52 µs, and four near 29 µs. Values repeating to the nanosecond mean the path is deterministic and something discrete is selecting between a small number of routes. The likeliest candidate is what the processor was doing when you pressed: waking the idle thread is a different journey from pre-empting a busy worker mid-loop.
The silence is not nothing. For roughly 55 ms of every 100, no probe moves at all. That is the idle thread, and what it executes is a WFI instruction that stops the core until the next interrupt. You are looking at the processor asleep. That flat region is where all battery-powered design happens: the sleepy sensor work in my XIAO series is, in essence, the art of making it as wide as possible.
Poking the kernel with the shell
The serial prompt is a real shell into the running kernel. Three commands to try immediately:
kernel thread grew a set of subcommands, so the plural kernel threads and the standalone kernel stacks no longer exist. Type either and the shell quietly prints the kernel help instead of an error, which is a confusing way to be told you are wrong: it looks as though the command ran and produced the wrong thing. The current spellings are kernel thread list and kernel thread stacks. If a command ever answers you with its own help text, that is the shell's way of saying the syntax did not match, and the listed subcommands are the answer.uart:~$ kernel thread list
uart:~$ kernel thread stacks
uart:~$ device list
kernel thread list prints every thread in the system with its priority, state, stack usage and share of the CPU. Here is the real thing, abridged only in whitespace:
uart:~$ kernel thread list
Scheduler: 153 since last call
Threads:
 0x200001b0 ticker
        options: 0x0, priority: 3 timeout: 251
        state: sleeping, entry: 0x8000619
        Total execution cycles: 217477890 (4 %)
        stack size 1024, unused 848, usage 176 / 1024 (17 %)
0x200000e8 responder
        options: 0x0, priority: 1 timeout: 0
        state: pending, entry: 0x8000671
        Total execution cycles: 1172 (0 %)
        stack size 1024, unused 824, usage 200 / 1024 (19 %)
0x20000278 busy_b
        options: 0x0, priority: 5 timeout: 0
        state: sleeping, entry: 0x8006b2b
        Total execution cycles: 1275705975 (23 %)
        stack size 1024, unused 824, usage 200 / 1024 (19 %)
0x20000340 busy_a
        options: 0x0, priority: 5 timeout: 222
        state: sleeping, entry: 0x8006b2b
        Total execution cycles: 902170327 (16 %)
        stack size 1024, unused 824, usage 200 / 1024 (19 %)
*0x20000418 shell_uart
        options: 0x0, priority: 14 timeout: 0
        state: queued, entry: 0x8002651
        Total execution cycles: 1534033 (0 %)
        stack size 2048, unused 992, usage 1056 / 2048 (51 %)
0x200005b0 idle
        options: 0x1, priority: 15 timeout: 0
        state: , entry: 0x8008e95
        Total execution cycles: 2964390341 (55 %)
        stack size 320, unused 256, usage 64 / 320 (20 %)
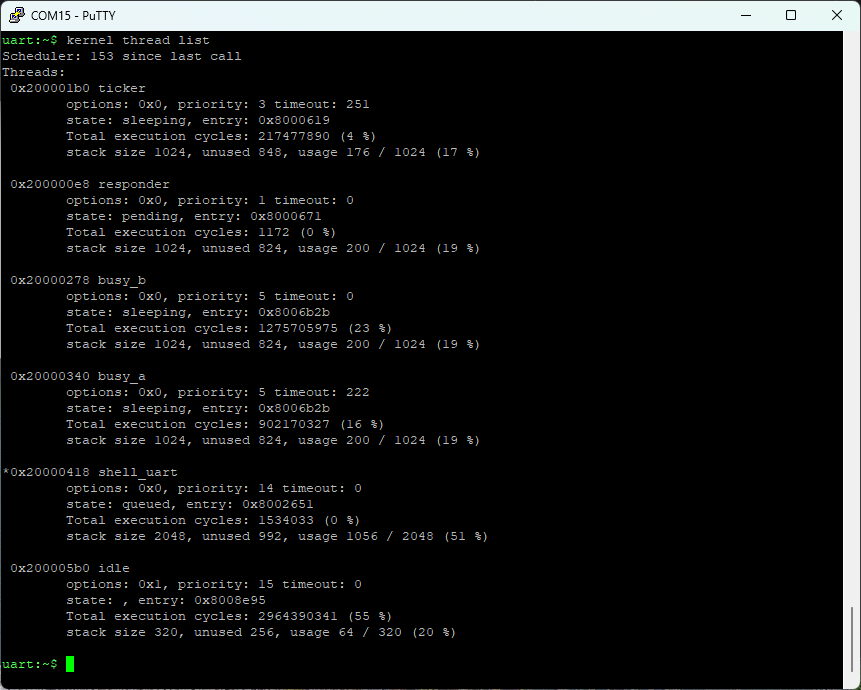
kernel thread list on a freshly reset board. Six threads, our four plus shell_uart and idle, with priority, state, cumulative CPU share and stack high-water mark for each. Note responder at 1,172 cycles: it has been alive since boot and has done essentially nothing, because nobody has pressed the button.Everything the article has claimed so far is in that listing. busy_a and busy_b sit at priority 5 sharing one entry point, the ticker at 3, the responder at 1 and pending, which is what a thread blocked on k_sem_take(K_FOREVER) looks like from the outside. The asterisk marks the thread doing the printing, which is why it is on shell_uart.
Four things in that output repay a careful read.
The CPU percentages settle the argument from the last section, and they are not the numbers you might expect. With CONFIG_THREAD_RUNTIME_STATS enabled each thread reports its share of total CPU time, so this is a completely independent measurement of the same behaviour the analyser draws. Take the ticker first, because it is the clean one: 4%, and it runs a 1 ms busy-wait every 25 ms, which is 1/25 exactly. The kernel's accounting is trustworthy.
Now the busy workers: 16% and 23%. Neither is the 20% predicted, but add them and you get 39%, against a prediction of 40%, and that is the number that means something. (Those four figures, 4 / 16 / 23 / 55, came back identical on a second run after a reflash and a reboot, so they are the system's steady state rather than a lucky sample.) Two threads each getting 20 ms of CPU out of every 100 ms is 40% of the machine, and that is what the kernel reports. The split between them wanders because these are cumulative counters sampled at an arbitrary instant, and one of them had wrapped. idle then takes 55%, against the 57% left over after 39 and 4. The 55 ms of silence on the analyser and the idle thread's 55% are the same fact, measured twice by unrelated mechanisms, and neither knew about the other.
That is the whole point of taking two measurements. Had the workers come out at 30% each, the wall-clock-versus-CPU-time argument would be wrong.
There are threads in your system that you did not write, and they are not where you would guess. shell_uart at priority 14 and idle at 15 both appeared without being asked for. Note what that means: everything you wrote outranks everything the system added, which is why experiment 5 below can starve the shell simply by working harder. Worth knowing the range you are playing in: this build has CONFIG_NUM_PREEMPT_PRIORITIES=15 and CONFIG_NUM_COOP_PRIORITIES=16, so the pre-emptible band runs 0 to 15 and the cooperative one from -1 down to -16. Our four threads occupy the crowded end of a much larger space.
main is missing, and that is the proof of something from earlier. The listing has six threads and none of them is main. Its stack was reclaimed the moment it returned, exactly as the code comment promised, and the four K_THREAD_DEFINE threads carried on without it. On the Arduino model, where leaving loop() is unthinkable, this takes some getting used to.
kernel thread stacks replaces folklore with numbers. It reports the high-water mark of every stack: the deepest each has actually gone since boot. Run it after pressing the button a few times, so the responder's printk path is included in the worst case.
uart:~$ kernel thread stacks
0x200001b0 ticker     (real size 1024):  unused  848  usage  176 / 1024 (17 %)
0x200000e8 responder  (real size 1024):  unused  784  usage  240 / 1024 (23 %)
0x20000278 busy_b     (real size 1024):  unused  824  usage  200 / 1024 (19 %)
0x20000340 busy_a     (real size 1024):  unused  824  usage  200 / 1024 (19 %)
0x20000418 shell_uart (real size 2048):  unused  984  usage 1064 / 2048 (51 %)
0x200005b0 idle       (real size  320):  unused  256  usage   64 /  320 (20 %)
0x20002600 IRQ 00     (real size 2048):  unused 1792  usage  256 / 2048 (12 %)
Those 1024 figures in the K_THREAD_DEFINE lines were a guess, and the measurement says the guess was generous by a factor of four. The deepest of our four threads is the responder at 240 bytes. Halving all four to 512 would still leave more than twice the observed headroom and hand back 2 KB of RAM.
Two entries you did not create are worth a look. idle is given 320 bytes and uses 64, because a thread whose entire job is WFI needs almost nothing. And IRQ 00 is not a thread at all: it is the interrupt stack, the separate 2 KB region every ISR runs on, CONFIG_ISR_STACK_SIZE. Its 256-byte high-water mark is the deepest your interrupt handlers have nested. Blowing that stack is a particularly baffling class of crash, because the fault appears in whatever thread happened to be interrupted rather than in the handler that caused it, so it is worth knowing the number exists and where to read it.
Finally, device list shows the driver model from the other side.
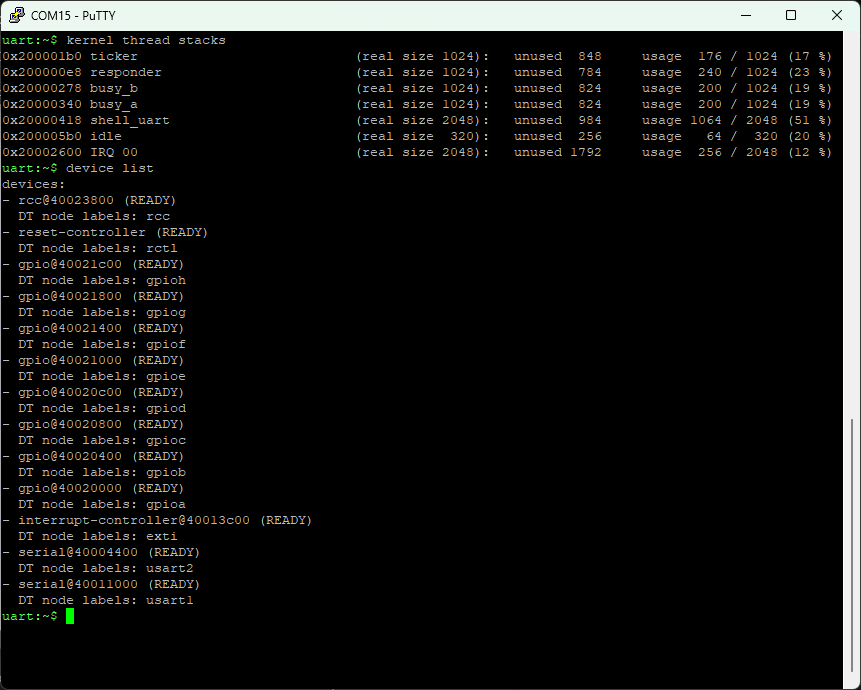
kernel thread stacks followed by device list. This session had the button pressed a few times, which is why responder shows 240 bytes here against 200 in the listing above. The last row of the stacks output, IRQ 00, is not a thread at all but the shared interrupt stack.Every device the devicetree instantiated appears with its node label and its initialisation state, and all of them here report READY. Reading down the list you can see the machine assemble itself: rcc the clock controller, then gpioa through gpioh, then exti for the interrupt lines the button needs, then usart1 and usart2. That is the payoff of the devicetree section: you wrote DT_ALIAS(led0) and zephyr,user, and this is the set of real driver instances the build turned that into. When a gpio_is_ready_dt() check fails, this is the first place to look, because a device that is not READY never got past its init function.
Experiments
The firmware is a laboratory; these five experiments each need a one-line change, a rebuild, and a fresh capture. Predict the trace before you look:
- Kill the timeslice. Set
CONFIG_TIMESLICE_SIZE=0. Equal-priority threads now run until they block, so whichever busy worker starts first keeps the CPU for its whole 30 ms while the other waits, and the alternating blocks collapse into two solid ones. Note the second-order effect, which is the more interesting half: without sharing, each worker now gets the full 30 ms of CPU it asked for, so the total activity per period grows from 40 ms to 60 ms even though nothing about the workload changed. Round-robin is a configuration choice. - Break the tie. Change
busy_b's priority from 5 to 6. B now runs only in the time A leaves behind: A's block sits at the start of every period, B's after it, regardless of the timeslice setting. Priorities dominate; timeslicing only arbitrates within a priority. - Demote the ticker. Change the ticker's priority from 3 to 10. Its pulses stay perfectly regular during the quiet 40 ms but arrive late (or pile up) during the busy window, because it now has to wait for the busy threads to finish. This is priority inversion's relation, starvation, and you can measure the jitter directly.
- Go cooperative. Change a busy worker's priority from
5to-1in itsK_THREAD_DEFINE. Cooperative threads cannot be pre-empted at all, so press the button during its busy window and watch the responder's burst wait its turn. Watch D4 as well, because the ticker is blocked by exactly the same rule and its metronome pulses will stall too, which is the more dramatic half of the trace. Two characters changed, and your system's worst-case latency went from microseconds to tens of milliseconds: this is why cooperative priorities are reserved for short, critical sections, and why thesysworkqyou met in the shell runs at -1 but does almost nothing. - Starve the shell. Raise
BUSY_MSto 95. The busy threads now consume nearly everything, and the shell (a low-priority thread) turns really slow while the button response stays instant. You have just reproduced the classic failure mode of a real product: "the device works but the console is dead", diagnosed in one capture.
Where this leaves you
You installed a complete RTOS toolchain, built and flashed a real multithreaded application, and, more importantly, you watched the scheduler make its decisions: round-robin slices, pre-emption, and interrupt-to-thread handover are now things you have measured rather than read about. The four-file project shape (CMakeLists.txt, prj.conf, an overlay, src/) is the same shape as every larger Zephyr project, including the networked ones later in this series.
In a future article, the same board and the same four-probe demo get rebuilt in async Rust with Embassy, no RTOS underneath, and the analyser gets to referee the comparison: what does cooperative async/await scheduling look like on the same wires, and what do you give up without pre-emption? After that, we take this exact project and run it, unchanged except for overlays, on two more boards.

